Notes
TenK10K at ETS2: a blood chromatin atlas recovers an IBD mechanism
On Genetic variants shape single-cell chromatin accessibility and disease risk, by Xue et al., Nature, 2026.
The TenK10K chromatin atlas
TenK10K is a single-cell genetics program led from the Garvan Institute in Sydney, and on 28 October Nature published three of its papers. Xue et al. build the TenK10K chromatin atlas, a map of which stretches of regulatory DNA are open in each type of blood immune cell, and how inherited variants change that.
- Xue et al. profiled 3.5 million blood immune cells from 922 people with whole-genome sequences and sorted them into 28 immune cell types.
- They mapped 243,225 chromatin accessibility QTLs (caQTLs) at 100,483 peaks, and the paper classes 60% of them as cell-type specific.
- A companion paper (Cuomo et al.) builds the matching expression atlas, with expression QTLs in 5.4 million cells from 1,925 people.
- When the authors join the two, they link 28,834 open-chromatin peaks to 11,204 genes.
Xue et al. posted their summary statistics on Hugging Face, and Cuomo et al. posted theirs on Zenodo. I'm grateful to the TenK10K team for making so much of their results open and easy to use. The Hugging Face files carry a CC BY 4.0 license and can be read in place, so the code in this note reads only the parts it needs from a 940 MB file, without downloading the whole file.
The cells come from peripheral blood, at rest. The chromatin donors come from the Tasmanian Ophthalmic Biobank, and the expression atlas adds BioHEART, a cohort of cardiology patients. All of the donors are of European ancestry.
What a caQTL looks like
A caQTL is a genetic variant associated with how open a nearby stretch of chromatin is (measured by scATAC-seq) in a particular cell type. That means people who carry one version of the variant have that stretch more open, on average, than people who carry the other. Figure 1 shows one, at a peak of open chromatin in CD14 monocytes near the gene ETS2, which the rest of this note is about. On the left, each dot is one of the 7,356 variants within 1 Mb that TenK10K tested against the peak's openness, and all 23 with P below 10⁻¹⁰⁰ lie within 10 kb of the peak. Seven variants tie at the top with identical results, because in these donors they are always inherited together.
On the right is the caQTL test itself, at one of them, rs2836882. Everyone carries two copies of each variant, one from each parent, and at rs2836882 each copy is either G or A, so a person is AA, AG or GG. For each of the 922 donors, the atlas pools the single-cell ATAC-seq reads from their CD14 monocytes to measure how open the peak is, then tests whether openness is associated with the donor's genotype. It is, strongly: each copy of G, the more common version, opens the peak by about 0.95 normalized units.
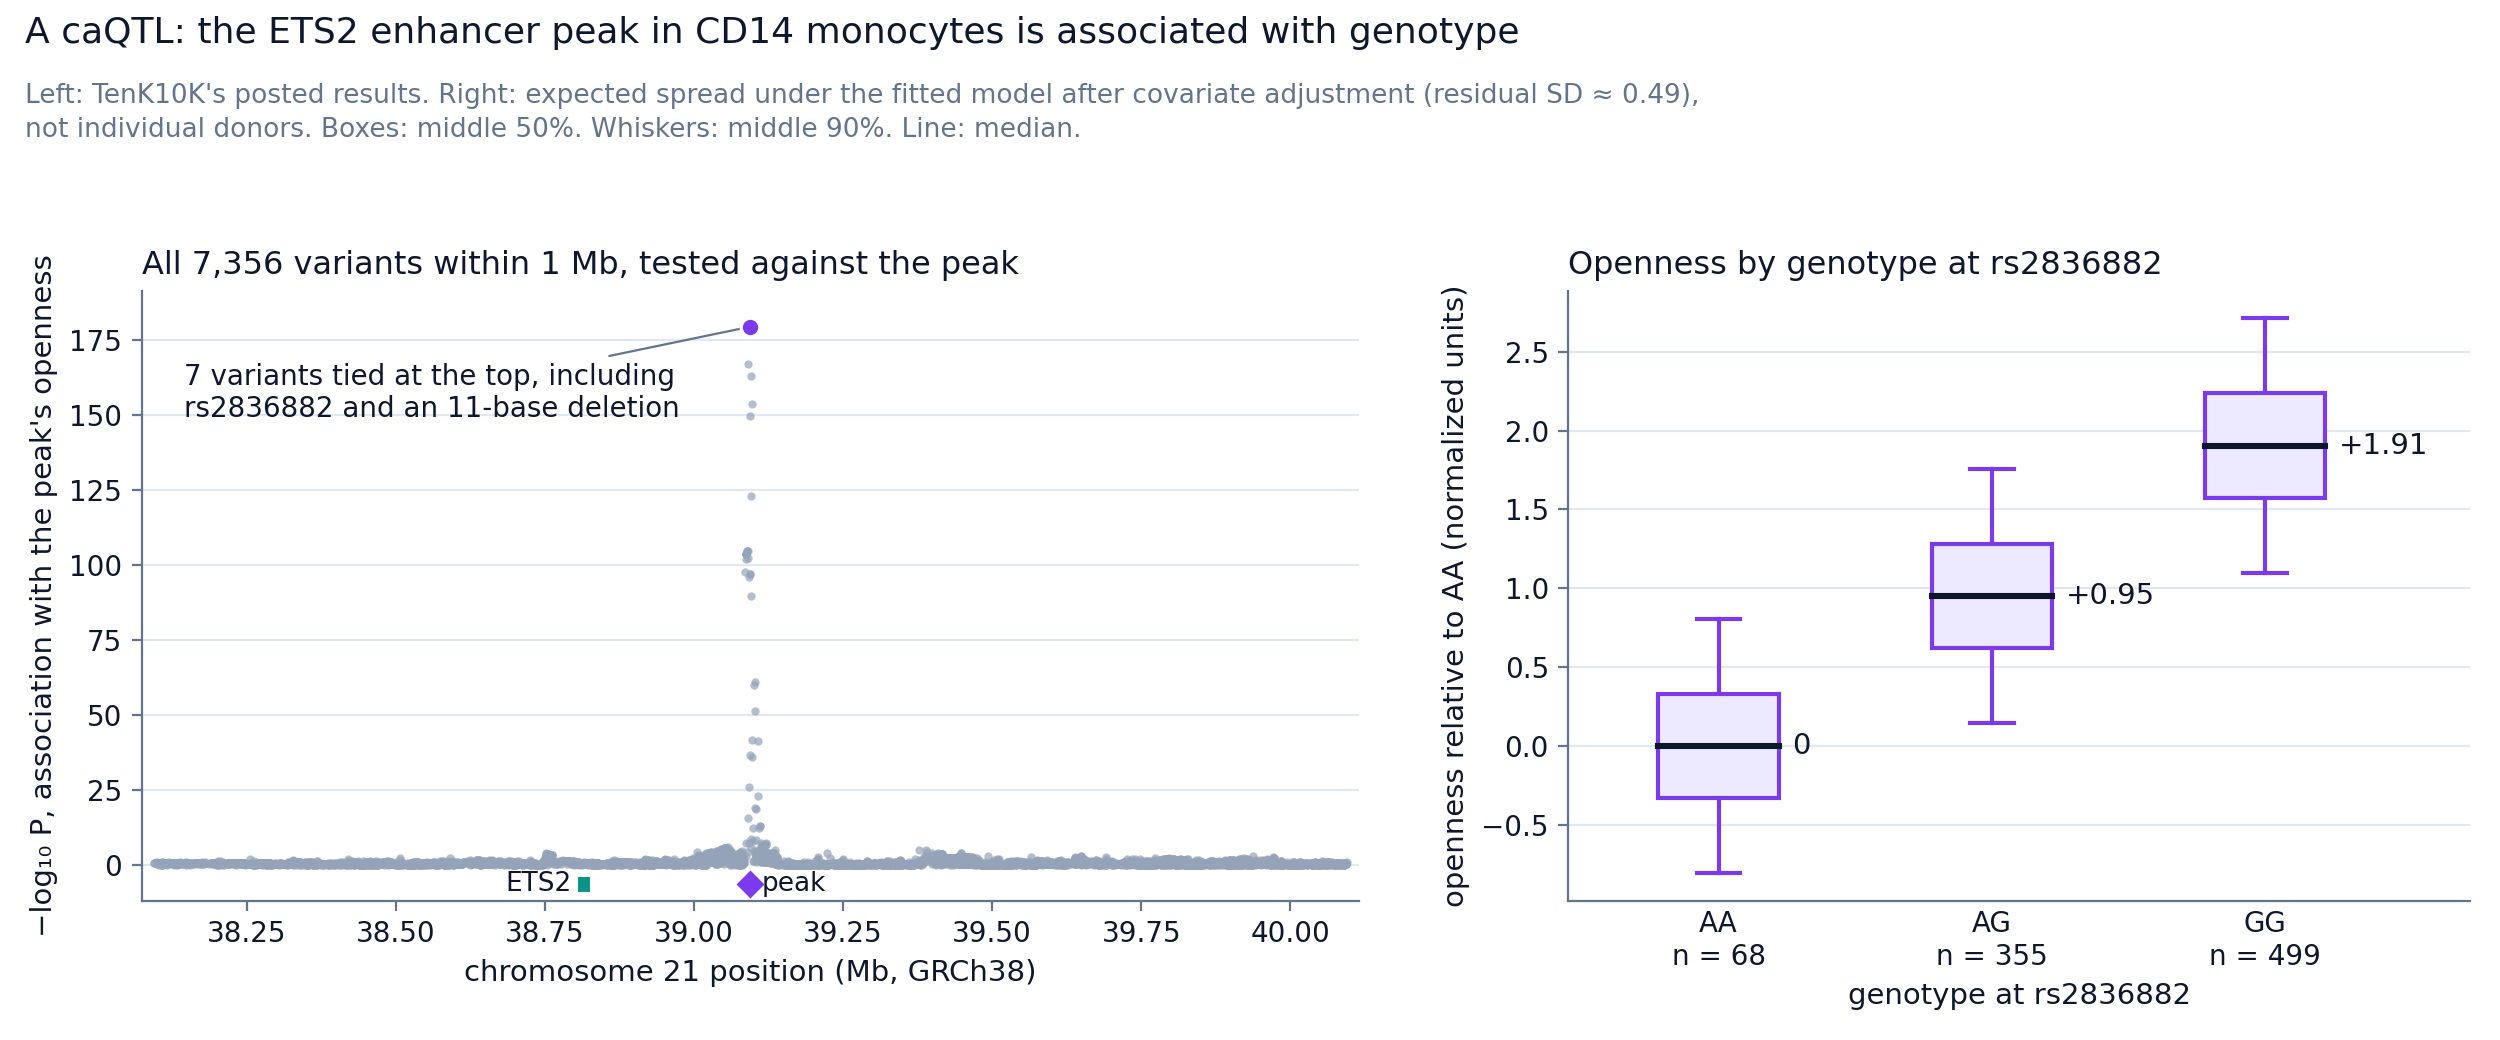
Figure 1. A caQTL at the ETS2 enhancer in CD14 monocytes. Left, every variant within 1 Mb tested against the peak. Right, the peak's openness by genotype at rs2836882, model-based.
TenK10K's per-donor values are under controlled access, so the boxes are built from the posted effect size and its standard error. Each median is the fitted value, and the spread is what the model implies after its covariates are removed, an SD of about 0.49 against about 0.8 before adjustment.
Show the code behind Figure 1's numbers
import fsspec
import pyarrow.compute as pc
import pyarrow.parquet as pq

URL = ("https://huggingface.co/datasets/anglixue/TenK10K_multiome/resolve/main/"
       "caQTL_common_TensorQTL/CD14_Mono/TenK10K.cis_qtl_pairs.chr21.parquet")
PEAK = "chr21:39094096-39094839"   # the ETS2 enhancer peak

# Read only the row groups that hold this peak (the file is about 940 MB)
with fsspec.filesystem("http").open(URL, "rb", block_size=8 * 2**20) as f:
    pf = pq.ParquetFile(f)
    hits = [i for i in range(pf.metadata.num_row_groups)
            if pc.any(pc.equal(pf.read_row_group(i, columns=["phenotype_id"])["phenotype_id"], PEAK)).as_py()]
    d = pf.read_row_groups(hits).to_pandas()
d = d[d.phenotype_id == PEAK]
print(len(d), "variants tested")                                 # 7356

# Left panel: the variants tied with rs2836882 at the top
rs = d[d.variant_id == "21:39094644:G:A"].iloc[0]
cols = ["slope", "slope_se", "ma_count", "ma_samples"]
print((d[cols] == rs[cols]).all(axis=1).sum(), "tied variants")  # 7

# Right panel: genotype counts from the posted carrier counts
n = round(rs.ma_count / (2 * rs.af))   # 922 donors
aa = rs.ma_count - rs.ma_samples       # 68 AA (A is the minor allele)
ag = rs.ma_samples - aa                # 355 AG
gg = n - aa - ag                       # 499 GG

# Residual SD from the slope's standard error: se = sigma / sqrt(sum((k - mean k)^2))
k = [0] * aa + [1] * ag + [2] * gg     # copies of G
mean_k = sum(k) / n
sigma = rs.slope_se * sum((x - mean_k) ** 2 for x in k) ** 0.5   # about 0.49
beta_g = -rs.slope                     # +0.95 per copy of G
for g, copies in (("AA", 0), ("AG", 1), ("GG", 2)):
    med = copies * beta_g
    print(f"{g}: median {med:+.2f}, box {med - 0.6745 * sigma:+.2f} to {med + 0.6745 * sigma:+.2f}, "
f"whiskers {med - 1.6449 * sigma:+.2f} to {med + 1.6449 * sigma:+.2f}")The plotting scripts for all seven figures, with pinned requirements and a one-command rebuild, are in tensoromics/notes.
A gene desert that drives macrophage inflammation through ETS2
Xue et al. is a huge effort, and the paper covers a lot of interesting science, from rare variants that change chromatin to a graph neural network that links peaks to genes. I haven't read all of it yet, and the first thing I went looking for was the ETS2 locus.
ETS2 is an interesting target for inflammatory bowel disease (IBD) and several other inflammatory diseases, including ankylosing spondylitis, primary sclerosing cholangitis and Takayasu's arteritis. They share a risk locus in a gene desert on chromosome 21 (Figure 2), a long stretch of DNA with no protein-coding genes.
In 2024, Stankey et al. showed that this locus works through ETS2, a gene 290 kb away that drives inflammatory macrophages. The risk variant, which most people carry, is in an enhancer that is active in monocytes and macrophages. Stankey et al. also found a possible route to a drug, through MEK inhibitors.
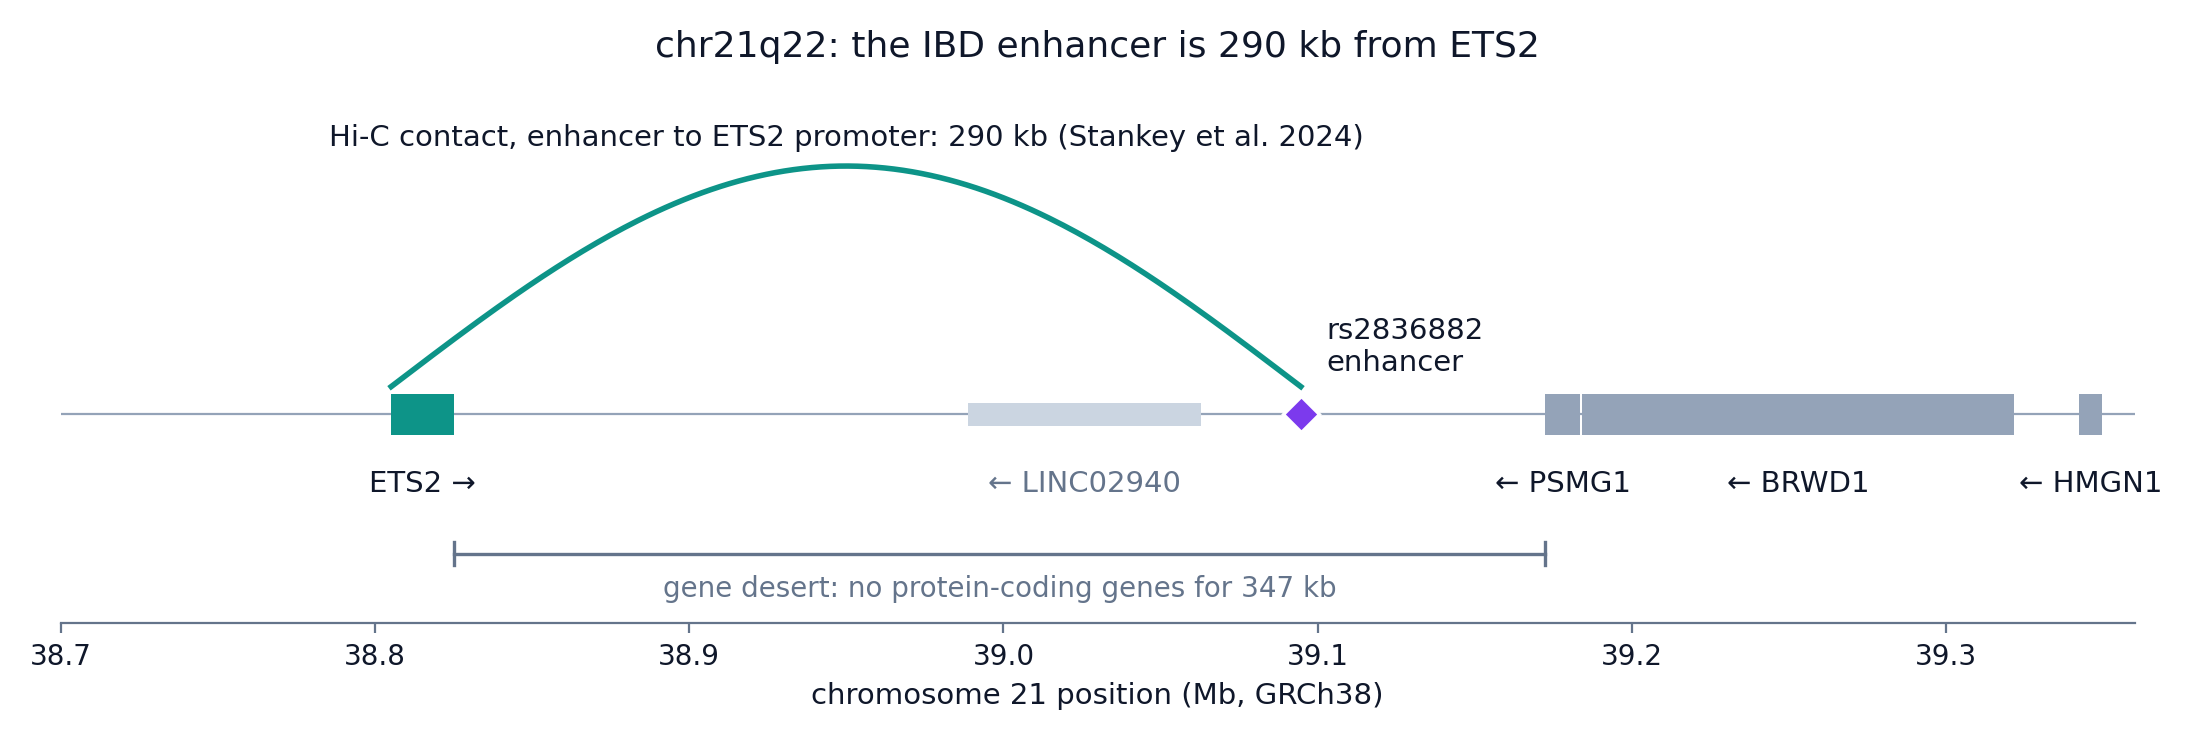
Figure 2. The chr21q22 locus. The rs2836882 enhancer lies in a gene desert and contacts the ETS2 promoter 290 kb away.
So here I focus on how the new data, from blood donors not selected for IBD, square with what we already know about ETS2. Most IBD risk variants are in non-coding DNA, and for most of them we don't know which gene they act on or in which cell. At this locus, Stankey et al. worked out the answer with detailed functional genomics in primary human cells, so we can see how much of it the TenK10K atlas recovers. The paper's own IBD showcase is ADCY7, where a variant's effect on chromatin changes as CD4 T cells differentiate.
How Stankey et al. traced the risk to ETS2
James Lee's group (Stankey et al., Nature 2024) traced the risk at this gene desert to ETS2 in five steps.
- Histone marks (H3K27ac) showed an enhancer in the locus that was active in monocytes and macrophages and not in the other immune cells they examined.
- Promoter-capture Hi-C showed the enhancer touches the promoter of ETS2, about 290 kb away. ETS2 is the most distant of the three nearby candidate genes, and the other two are PSMG1 and BRWD1. When they deleted the 1.85 kb enhancer with CRISPR in primary monocytes, ETS2 rose far less as the cells became inflammatory macrophages, while PSMG1 and BRWD1 did not change.
- When they fine-mapped the IBD GWAS, they could not separate the causal SNP from its linked neighbors. In a reporter assay, rs2836882 had the strongest effect of seven candidate SNPs, and its risk allele, G, drove more transcription. The risk allele also bound the pioneer factor PU.1 more than four times as strongly and carried more open chromatin.
- When they knocked out ETS2 in macrophages, inflammatory cytokines, phagocytosis and the oxidative burst all fell. When they overexpressed it in resting macrophages, the cells moved toward the transcriptional state of macrophages from Crohn's disease tissue.
- With no ETS2 inhibitor available, the group searched drug signatures and landed upstream, on MEK inhibitors. The MEK inhibitor PD-0325901 damped the ETS2 program in macrophages. In cultured gut biopsies from 10 patients with active IBD who were not on immunosuppressive or biologic drugs, it cut inflammatory cytokine release about as much as infliximab.
The risk allele is the common one. About 75% of chromosomes in Europeans carry it, by Stankey's figure, so carrying it says little about any one person. The locus is worth revisiting because every step from variant to macrophage was tested at the bench, one experiment at a time.
What TenK10K finds at ETS2
Xue et al. find the locus without any of Stankey's experiments, and cite them as agreeing.
| Question | Stankey 2024 (functional genomics) | TenK10K 2026 (population) |
|---|---|---|
| Which direction | Risk allele G raises enhancer activity, PU.1 binding and ETS2 expression | In the posted data, the protective A allele closes the peak, so the risk allele is the open one |
| Which variant | rs2836882, picked by reporter assay after GWAS fine-mapping could not separate the linked SNPs | Statistical fine-mapping ranks rs2836882 first, with a probability of 0.81 of being causal in CD14 monocytes |
| Which gene | Hi-C contact with the ETS2 promoter, about 290 kb away | Colocalization with ETS2 expression (PP.H4 = 0.996) appears only when the search window widens from ±100 kb to ±1 Mb |
| Which cells | Enhancer active in monocytes and macrophages | rs2836882 is inside an open-chromatin peak whose openness is associated with genotype in CD14 and CD16 monocytes and in cDC2 dendritic cells. Colocalization with IBD in CD14 monocytes: PP.H4 = 0.995 |
Direction: the risk allele opens the enhancer
At rs2836882, G is the IBD risk allele and A the protective one, so AA, AG and GG carry zero, one and two risk copies. G is also the ancestral allele, inferred from other primate genomes, so the protective A is the newer of the two.
Two kinds of evidence show the direction of the effects: TenK10K's own data, joined to the IBD GWAS through SMR, and Stankey's experiments.
SMR (summary-data-based Mendelian randomization) asks whether the peak's openness could lie on the path from the variant to IBD. It starts from two effects of the variant, each measured per copy of G:
- on the peak's openness in CD14 monocytes, +0.95 normalized units (TenK10K, Figure 1);
- on IBD, +0.143 log-odds, an odds ratio of 1.15 (95% CI 1.13–1.18, P = 5 × 10⁻⁴⁰), from the GWAS meta-analysis by Liu et al., whose values TenK10K's file matches.
SMR divides the second effect by the first (Figure 3), which gives +0.15 log-odds of IBD per unit of openness (P = 1.3 × 10⁻³⁵). Both effects are positive, so more open chromatin goes with more risk, and a GG carrier's odds of IBD are about 1.33 times an AA carrier's.
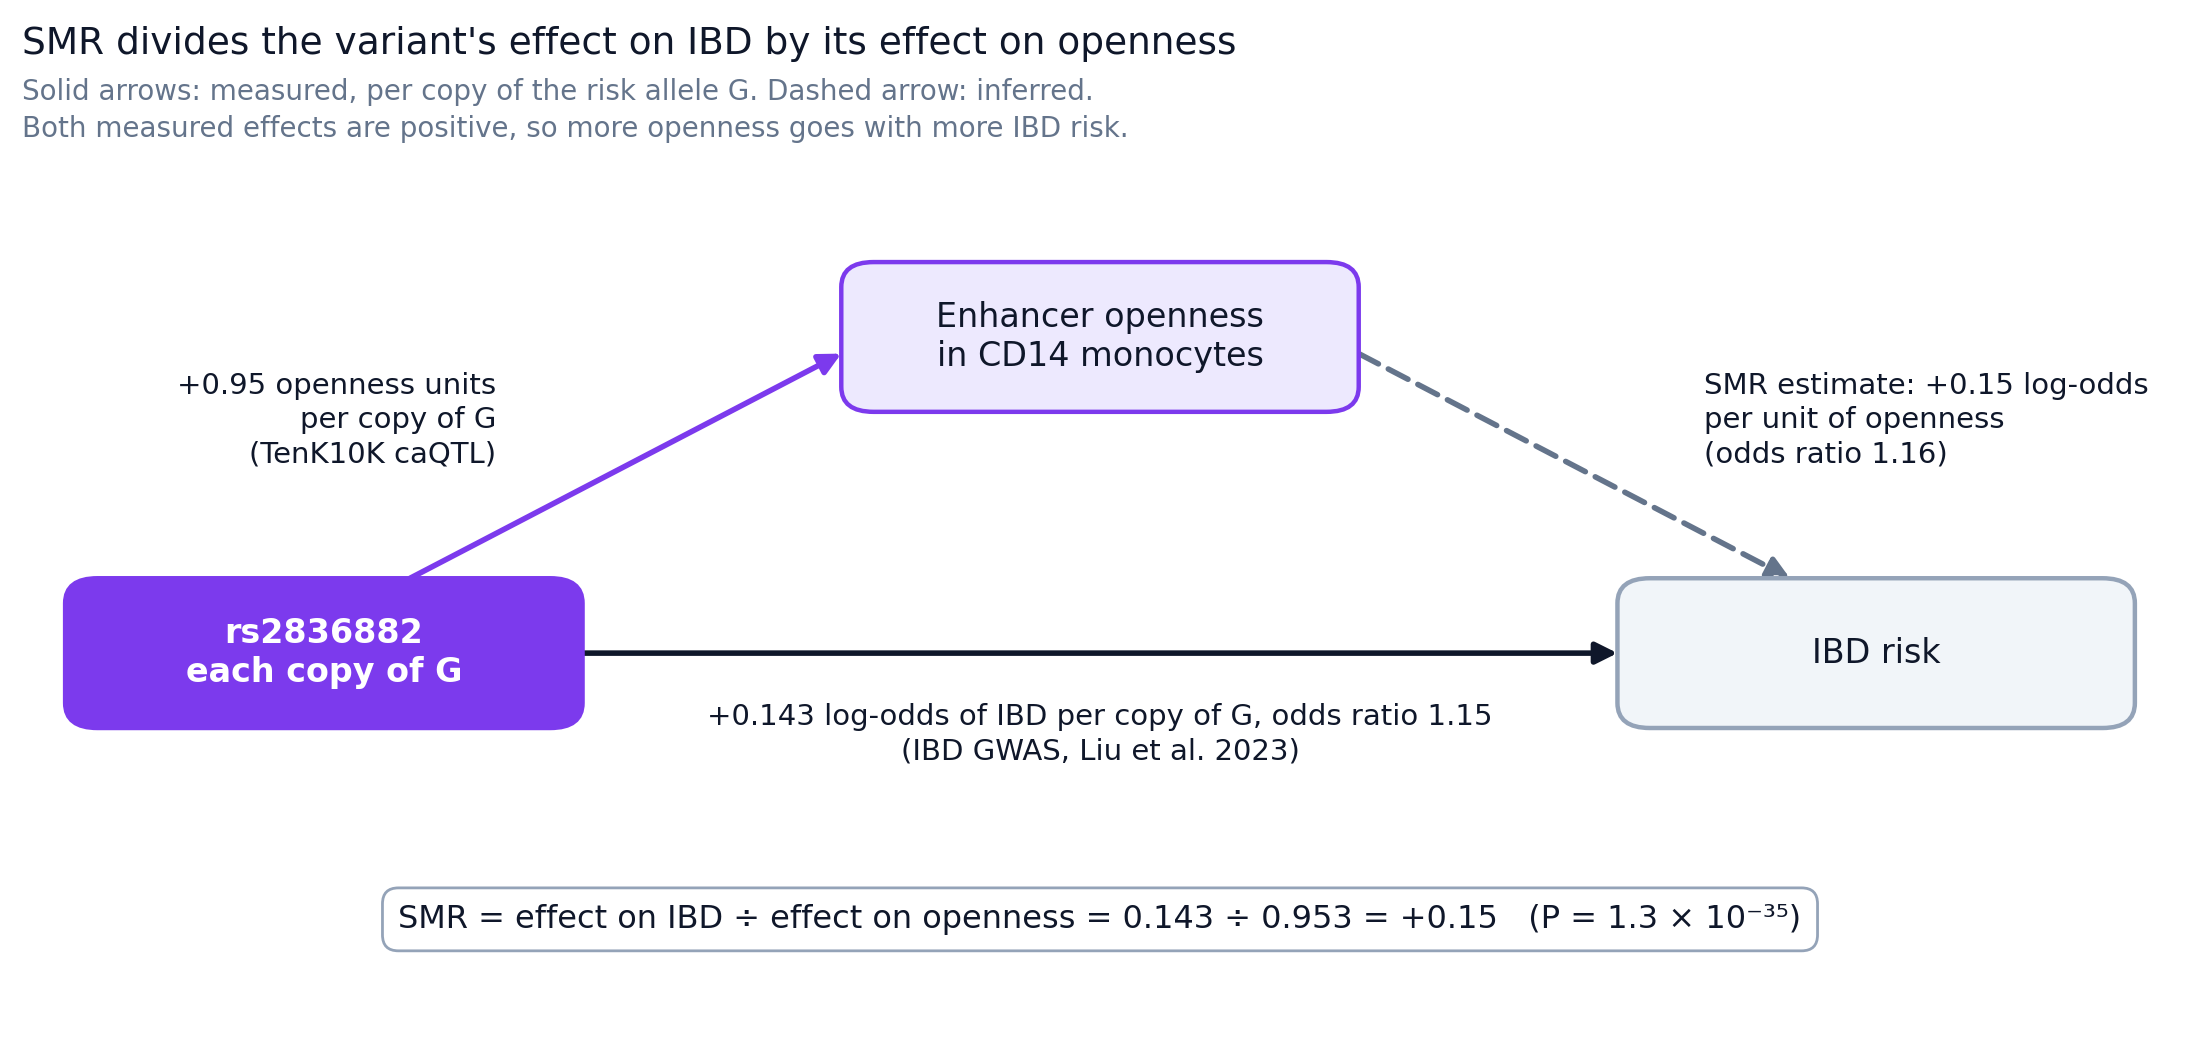
Figure 3. How SMR combines the variant's effect on openness with its effect on IBD.
TenK10K's file reports both effects per copy of A, the minor allele (frequency 0.27), so its signs are flipped: −0.95 and −0.143. Their ratio is the same +0.15, which is why SMR gives a positive estimate whichever allele we count. CD16 monocytes and the Crohn's disease GWAS from the same study give the same signs.
Stankey's experiments point the same way at every step from the variant to ETS2, and Figure 6, at the end of this section, puts all of the direction evidence together. One sentence in the main text of Xue et al. has the risk allele "reducing accessibility", which looks like a typo, since their Supplementary Note 2 and the posted data both make the risk allele the more open one.
Which variant: rs2836882 comes out on top
The seven variants tied at the top of Figure 1 are always inherited together in these donors, so the caQTL test alone cannot say which of them changes the enhancer. Stankey addressed this by experiment: their reporter assay tested a separate list of seven candidate SNPs from the IBD GWAS, which includes rs2836882, and rs2836882 had the strongest effect.
TenK10K approaches the same question with statistical genetics. Its fine-mapping (mvSuSiE) combines the IBD GWAS, the chromatin QTLs and the expression QTLs, and gives each variant a probability of being the causal one. In CD14 monocytes rs2836882 comes out on top, with a probability of 0.81 within a group of five candidates, and it also leads in CD16 monocytes (0.59) and cDC2 (0.44). That agrees with Stankey's pick, and a probability of 0.81 leaves some room for the other candidates.
One of the seven tied variants is an 11-base deletion, and neither paper tested it. Stankey's reporter assay covered SNPs only, and TenK10K's fine-mapping appears to have included only SNPs.
Which gene: the 100 kb window
The TenK10K expression atlas tests variants within 100 kb of each gene body, according to the Methods of Cuomo et al. ETS2 is at 38.805–38.825 Mb on chromosome 21 (GRCh38), and rs2836882 is at 39.095 Mb. That puts the SNP 290 kb from the start of the gene and about 270 kb from its far end, so at ±100 kb it is never tested against ETS2 (Figure 4). With a ±1 Mb window, the ETS2 eQTL colocalizes with IBD at PP.H4 = 0.996, against about 0 at ±100 kb. The authors' Extended Data Fig. 8a shows this directly: the ±100 kb expression track stops short of the GWAS peak, and the ±1 Mb track peaks at the same place as the chromatin QTL and the IBD GWAS.
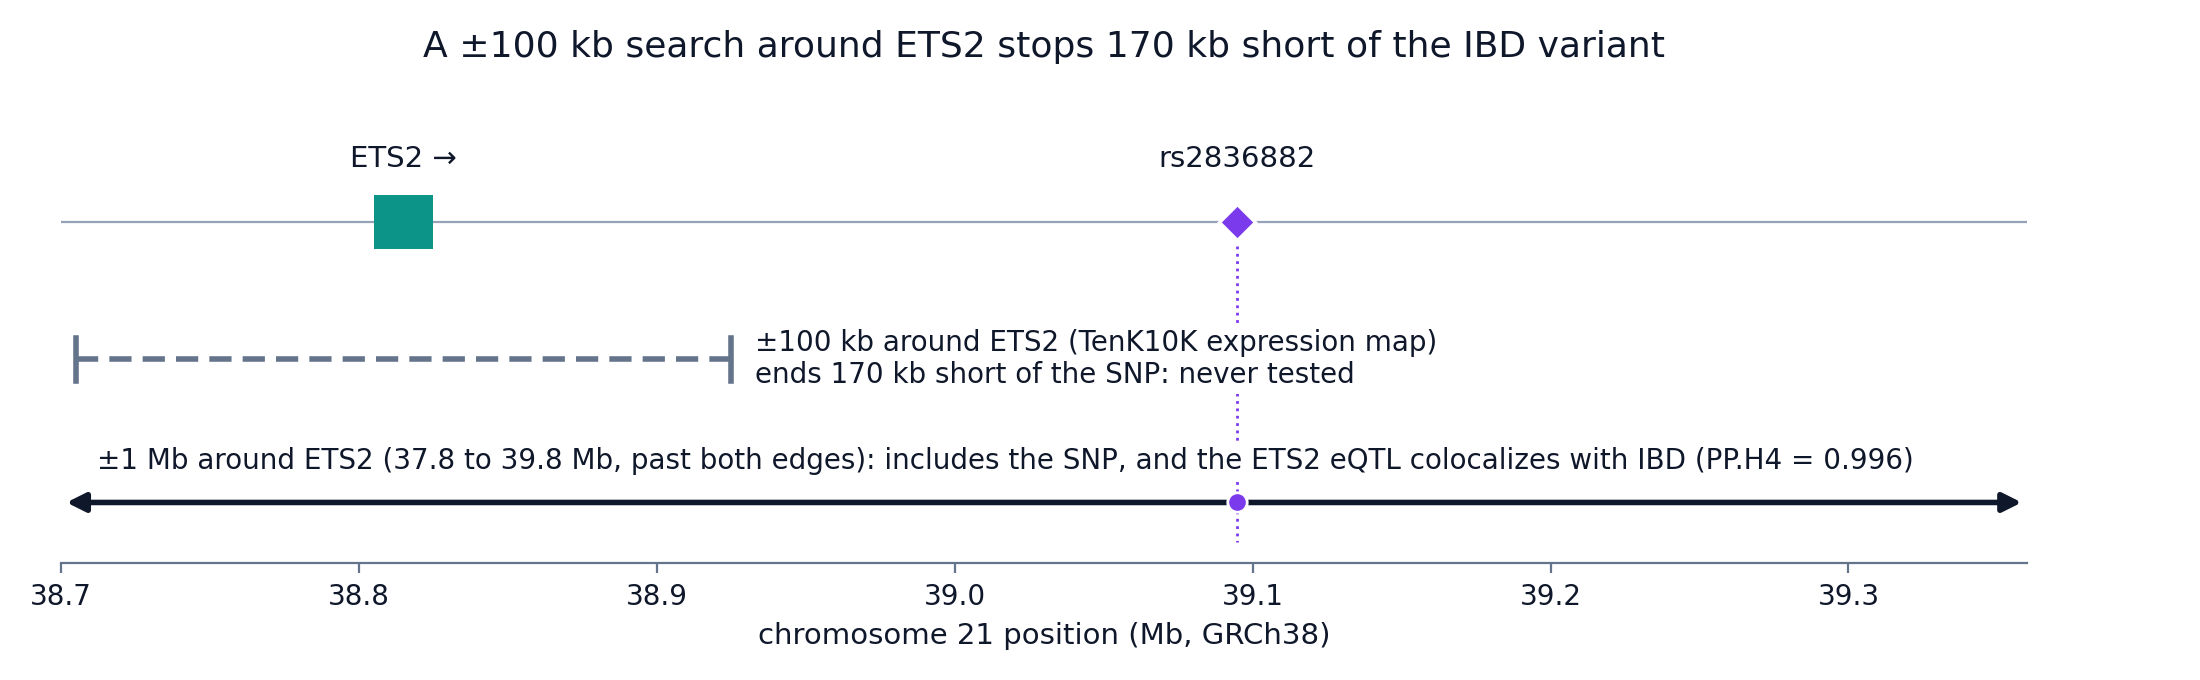
Figure 4. A ±100 kb search around ETS2 stops 170 kb short of the IBD variant, and a ±1 Mb search includes it.
Show the code behind the distances in Figures 2 and 4
import json
import urllib.request


def ensembl(path):
    req = urllib.request.Request("https://rest.ensembl.org" + path, headers={"Content-Type": "application/json"})
    return json.load(urllib.request.urlopen(req))


ets2 = ensembl("/lookup/symbol/homo_sapiens/ETS2")             # chromosome 21, + strand
psmg1 = ensembl("/lookup/symbol/homo_sapiens/PSMG1")
snp = ensembl("/variation/human/rs2836882")["mappings"][0]["start"]
print(ets2["start"], ets2["end"], snp)                         # 38805115 38824956 39094644

print(snp - ets2["start"], "bp from the ETS2 start")           # 289529, about 290 kb
print(snp - ets2["end"], "bp from the ETS2 end")               # 269688, about 270 kb
print(snp - (ets2["end"] + 100_000), "bp beyond the ±100 kb window")    # 169688, about 170 kb
print(ets2["start"] - 1_000_000 <= snp <= ets2["end"] + 1_000_000)      # True: inside ±1 Mb

# The gene desert: protein-coding genes between the end of ETS2 and the start of PSMG1
gap = f"/overlap/region/human/21:{ets2['end'] + 1}-{psmg1['start'] - 1}?feature=gene;biotype=protein_coding"
print(len(ensembl(gap)), "protein-coding genes in", psmg1["start"] - ets2["end"], "bp") # 0 in 347464 bpThe plotting scripts are fig2_ets2_locus.py and fig4_search_windows.py.
Xue et al. widened the window themselves and recovered the ETS2 colocalization, one of 35,382 gene–cell type–trait combinations they found affected by window choice. Window size changes individual loci, but chromatin keeps its overall lead: across the 164 IBD loci, chromatin QTLs colocalize at 72 and expression QTLs at 35, even with the ±1 Mb window. ETS2 fits that pattern, because the variant changes chromatin at the enhancer itself, and the gene it controls is 290 kb away.
LINC02940 is a non-coding RNA that lies between ETS2 and the SNP. When the authors fine-mapped the locus with LINC02940 as the target gene, rs2836882 again came out on top, with a probability of 0.86. So we cannot choose between the two genes from the statistics alone. Stankey's experiments point to ETS2: deleting the enhancer lowered ETS2, and knocking ETS2 out or overexpressing it changed how macrophages behave, though LINC02940 itself has not been tested.
Which cells: monocytes, plus cDC2
Figure 1 showed the caQTL in CD14 monocytes, and across cell types it is specific. TenK10K mapped caQTLs in 26 of its 28 cell types, leaving out two rare ones, and the peak has a caQTL in only three of them: CD14 monocytes, CD16 monocytes and cDC2 dendritic cells (Figure 5). In the other 23, the posted table shows no caQTL at this peak. That fits Stankey's finding that the enhancer is active in monocytes and macrophages and not in the other immune cells they examined.
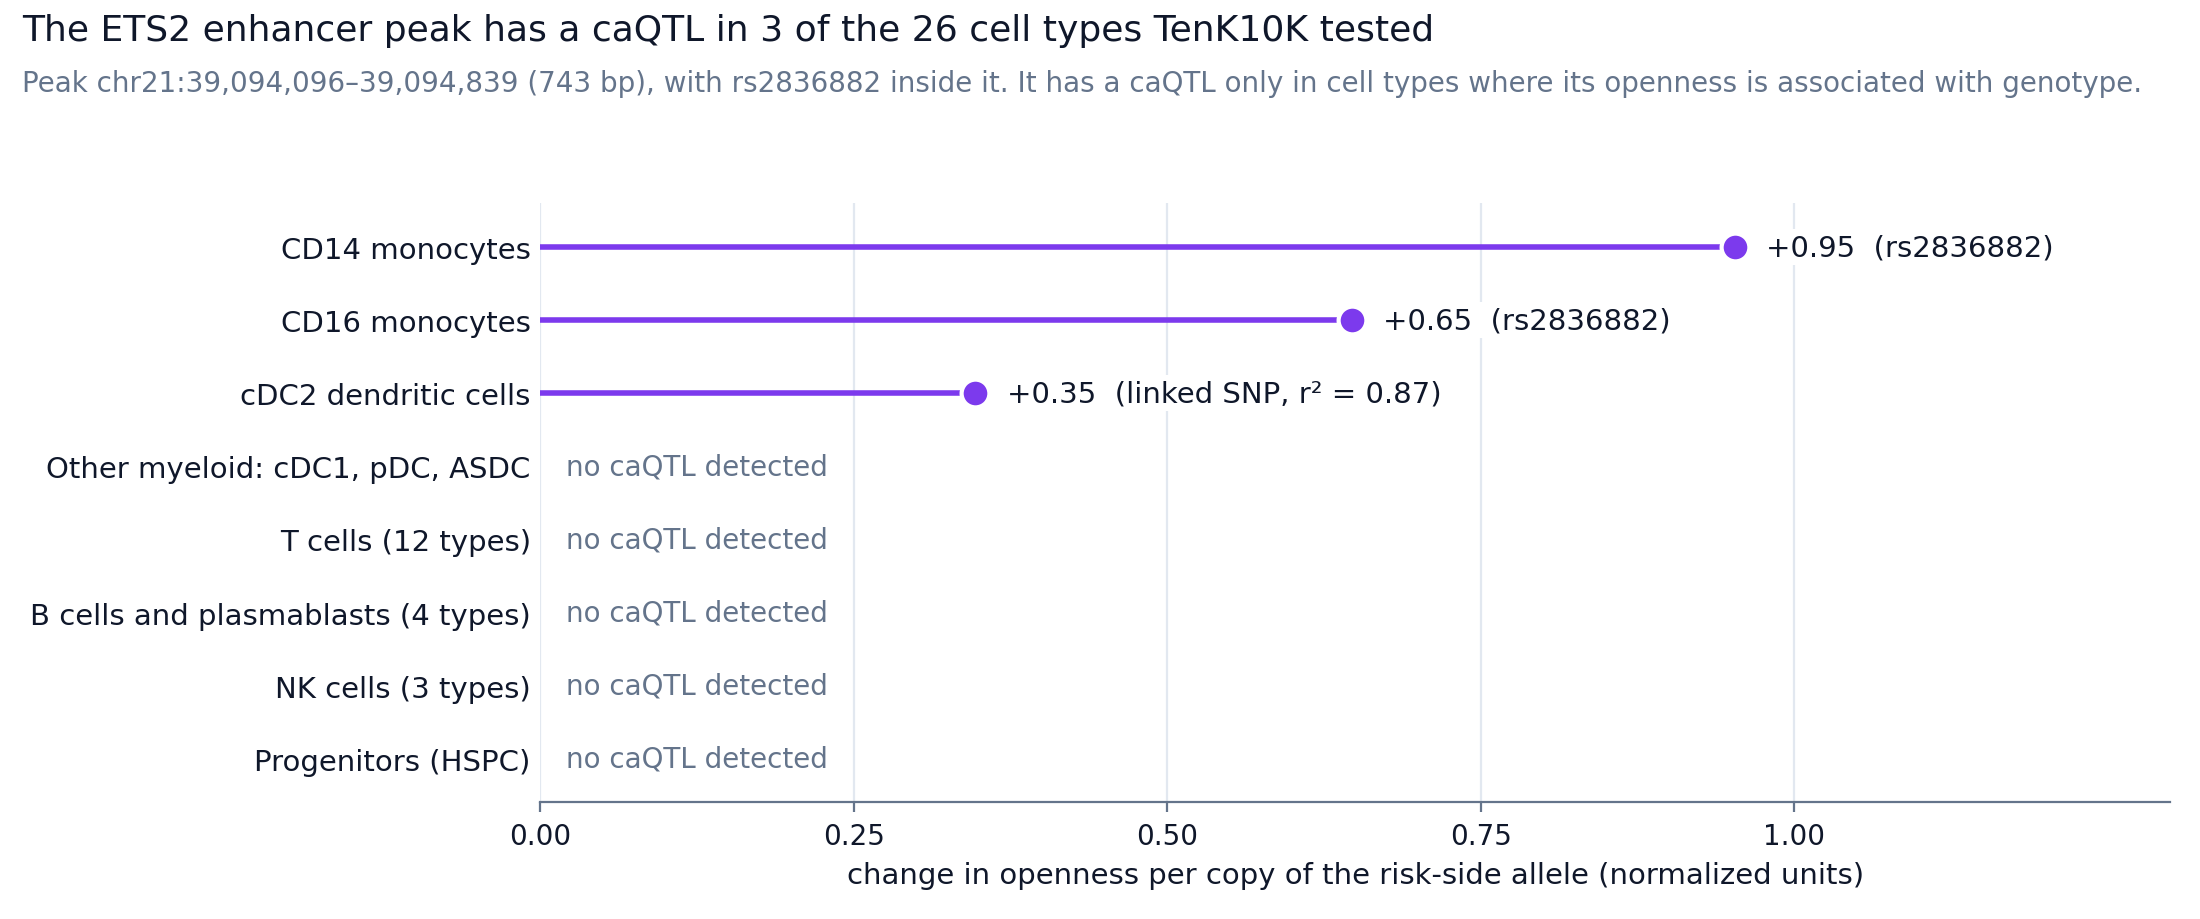
Figure 5. The ETS2 enhancer peak has a caQTL in 3 of the 26 cell types TenK10K tested.
Show the code behind Figure 5's numbers
import pandas as pd

URL = ("https://huggingface.co/datasets/anglixue/TenK10K_multiome/resolve/main/"
       "caQTL_common_TensorQTL/TenK10K.caQTL.1Mb.final_summary_qval005_feb02_2026_freeze.csv")
PEAK = "chr21:39094096-39094839"   # the ETS2 enhancer peak

leads = pd.read_csv(URL)   # the lead variant of every significant caQTL (q < 0.05) in every cell type, about 66 MB
print(leads.cell_types.nunique(), "cell types with caQTL results")   # 26
hits = leads[leads.phenotype_id == PEAK][["cell_types", "variant_id", "slope", "qval"]]
print(hits.to_string(index=False))
# CD14_Mono  21:39092834:CCTGTAATCCCA:C  -0.953  1.5e-156
# CD16_Mono  21:39092834:CCTGTAATCCCA:C  -0.647  2.1e-58
# cDC2       21:39096912:G:A             -0.347  2.0e-10
# In CD14 and CD16 monocytes the listed lead is the 11-base deletion, which ties with rs2836882.
# Slopes are per copy of A. Per copy of G, the risk-side allele, they are +0.95, +0.65 and +0.35.The plotting script for Figure 5 is fig5_caqtl_peak.py.
cDC2 is new relative to Stankey, who worked in monocytes and macrophages. In cDC2 the top variant at the peak is a different SNP, 21:39096912:G:A, in high linkage disequilibrium with rs2836882 (r² = 0.87, Supplementary Note 2). rs2836882 still comes out on top in the cDC2 fine-mapping, with a probability of 0.44. Dendritic cell labels near the monocyte lineage are also hard to draw. IBDverse, a single-cell atlas of gut tissue that I come back to below, reports that monocyte-derived dendritic cells cannot be told apart from cDC2 in its data. Published single-cell data from Crohn's tissue that Stankey re-analyzed did include conventional dendritic cells, marked by CLEC9A and XCR1 (the cDC1 type), and these expressed less ETS2 than inflammatory macrophages and monocytes. Whether ETS2 drives an inflammatory program in dendritic cells has not been tested.
The whole chain, from variant to disease
In Figure 6, each box is one step from the variant to the disease, and beside each box is the evidence that the step goes up with G: Stankey's work for the steps in between, TenK10K's data for the enhancer's openness, and the GWAS for IBD risk.
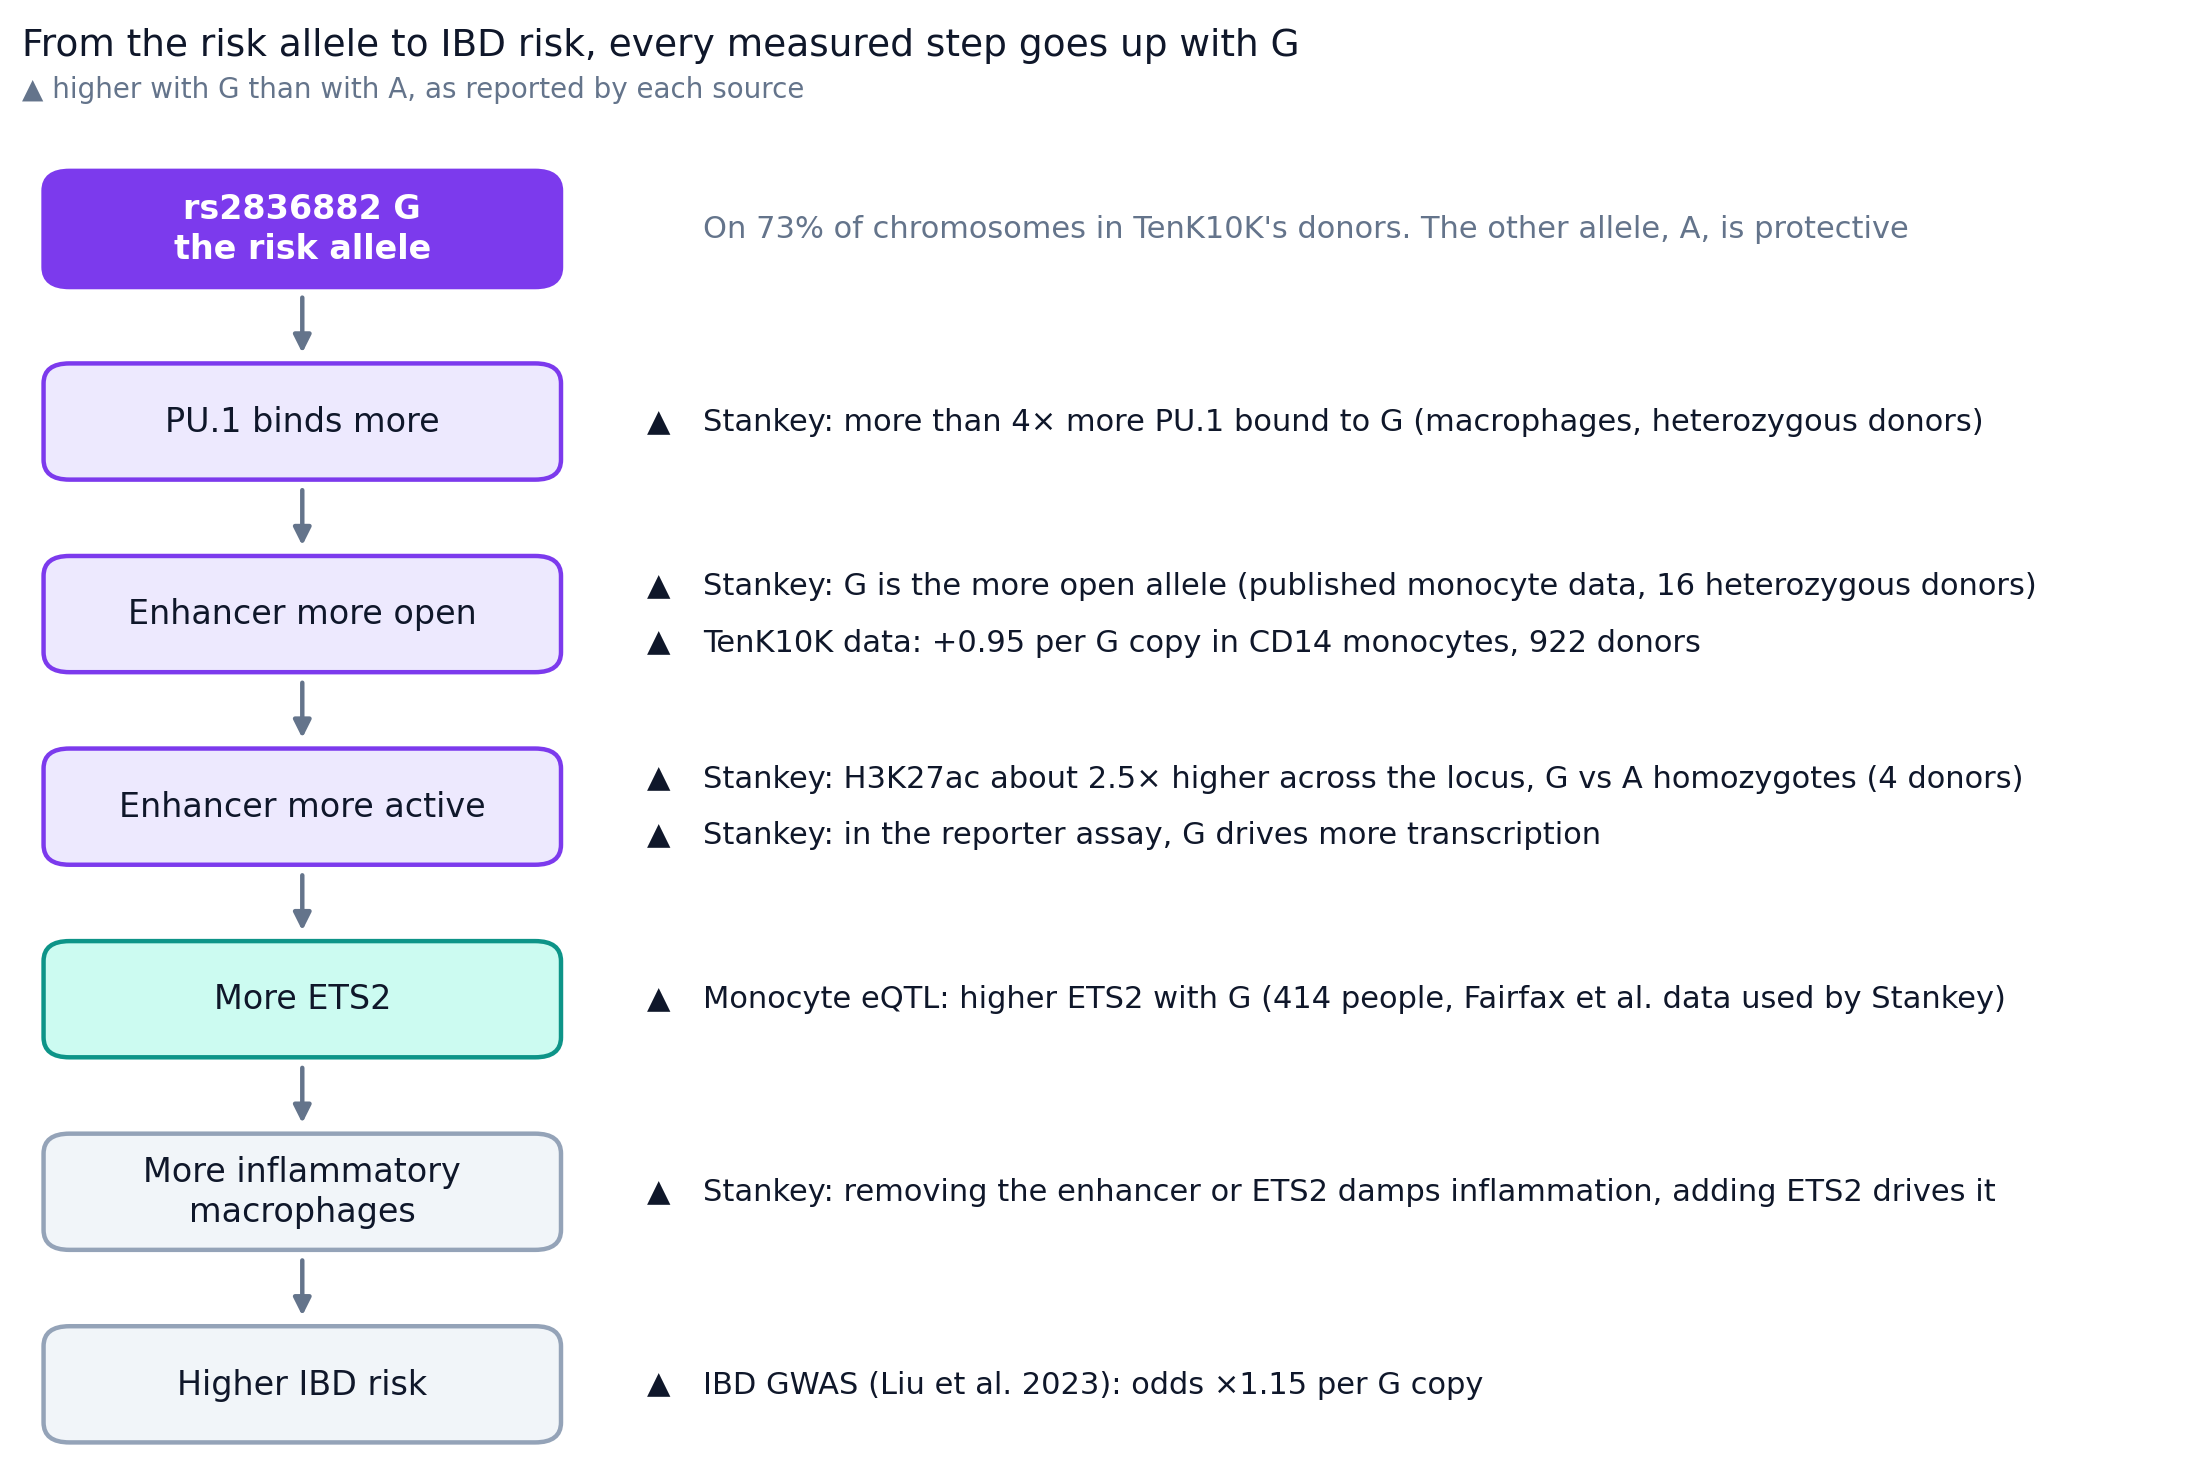
Figure 6. Every measured step from the risk allele G to IBD risk goes up with G.
For the openness step, Stankey's allele-specific accessibility analysis pooled published monocyte data from 16 heterozygous donors, both healthy people and patients with ankylosing spondylitis, and added two macrophage samples of their own.
The gut atlas: IBDverse
TenK10K measured chromatin in resting blood, from donors not selected for IBD. ETS2 acts in macrophages in inflamed gut, so the next place to look is gene expression in the gut itself, from patients. IBDverse, from Carl Anderson's and Tim Raine's groups (Alegbe et al., Nature, June 2026), mapped expression QTLs in 2.2 million cells from ileal and rectal biopsies and blood of 421 people, 125 of them with Crohn's disease, and tested variants within 1 Mb of each gene. The QTLs it found only at cell-type resolution look like ETS2. Their median distance to their gene is 200 kb, against 52 kb for QTLs seen with all cells pooled (Figure 7), and they regulate the nearest gene only about one time in five. So a ±100 kb search window would miss many of them.
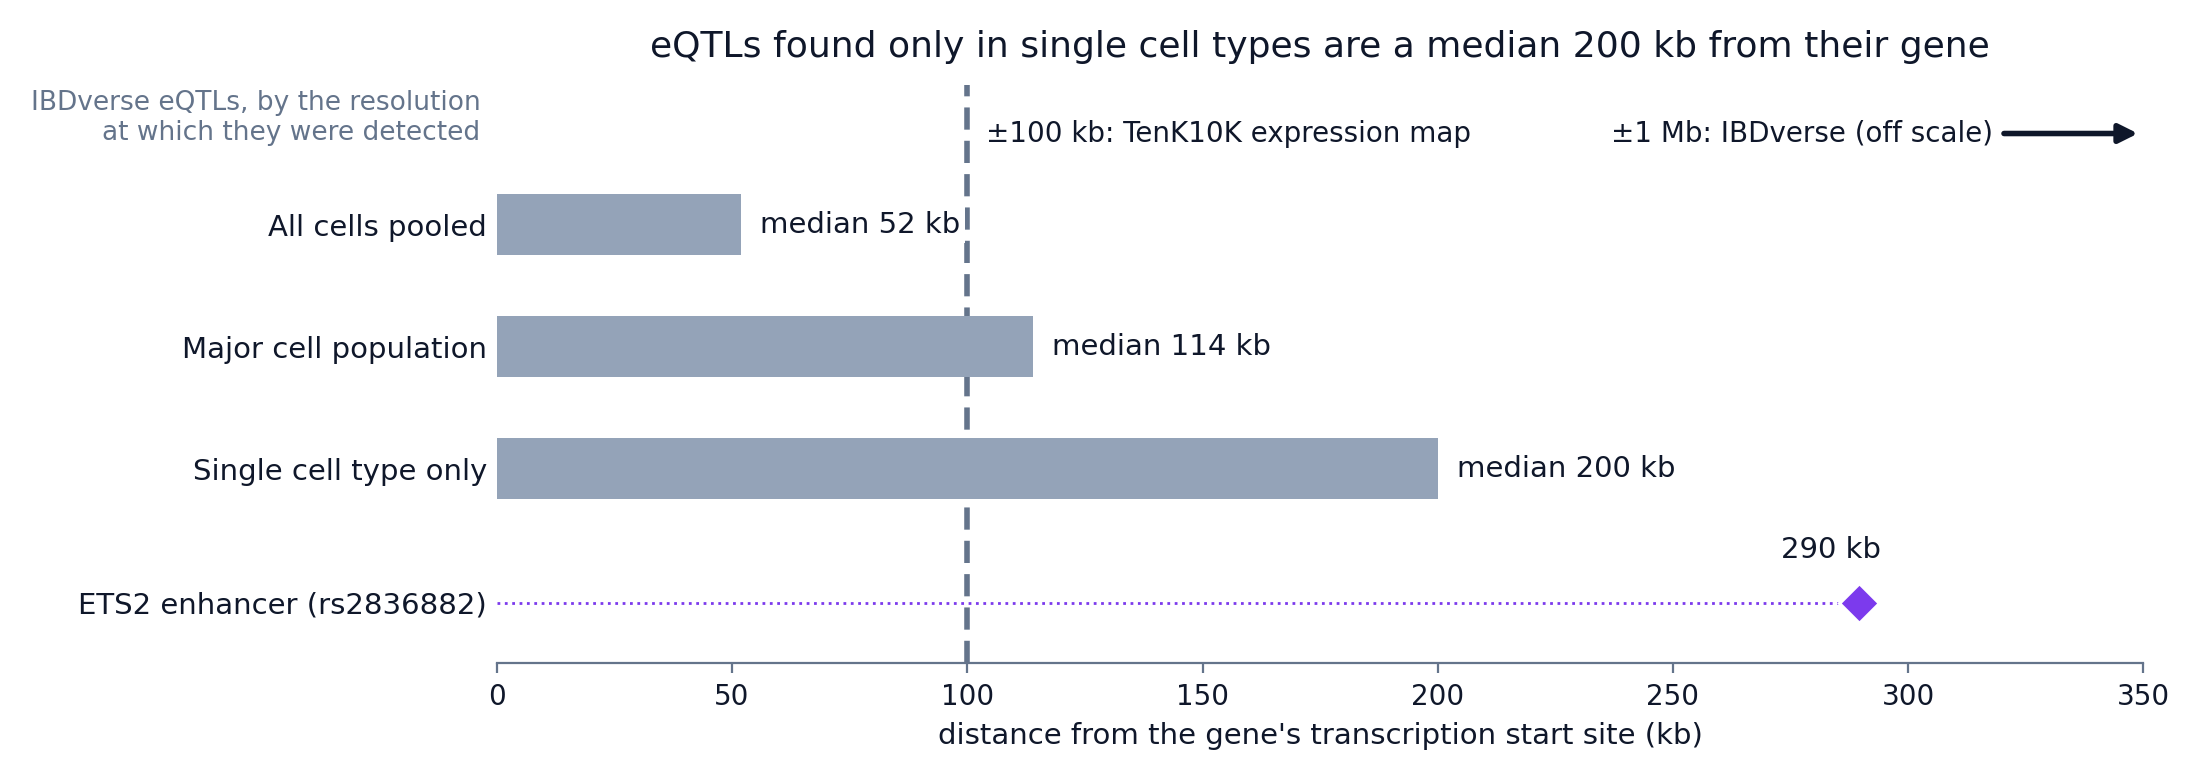
Figure 7. Median distance from IBDverse eQTLs to their gene's start site, by resolution, with the ETS2 enhancer for comparison.
Show the code behind Figure 7
import json
import urllib.request

import matplotlib.pyplot as plt

# ETS2 on GRCh38, from Ensembl, and the position of rs2836882
req = urllib.request.Request("https://rest.ensembl.org/lookup/symbol/homo_sapiens/ETS2",
                             headers={"Content-Type": "application/json"})
ets2 = json.load(urllib.request.urlopen(req))
ets2_kb = (39_094_644 - ets2["start"]) / 1000   # 289.5 kb from the ETS2 start site

# Median distance from an eQTL to its gene's start site, as reported in IBDverse's Results
medians_kb = {"All cells pooled": 52, "Major cell population": 114, "Single cell type only": 200}

fig, ax = plt.subplots(figsize=(8, 3))
ax.barh(list(medians_kb), list(medians_kb.values()), color="#94a3b8")
ax.plot([ets2_kb], ["ETS2 enhancer (rs2836882)"], "D", color="#7c3aed", markersize=9)
ax.axvline(100, ls="--", color="#64748b")       # TenK10K expression window: ±100 kb, measured from the gene body
ax.invert_yaxis()
ax.set_xlabel("distance to the gene's start site (kb)")
plt.show()This is a plain version of Figure 7, and the styled one is fig7_eqtl_distance.py.
IBDverse measures distance from the gene's start site, while the TenK10K window extends 100 kb from each end of the gene, so the dashed line in Figure 7 gives an approximate comparison. At 290 kb, the ETS2 enhancer is further out than the median for any resolution.
Even so, IBDverse's supplementary table of its 180 colocalized IBD loci has nothing near ETS2. Its two chromosome 21 entries, IFNGR2 and GATD3, are 5.7 and 4.9 Mb away. So IBDverse did not nominate a gene at this locus, and its paper does not discuss ETS2, so the reason is open. Power is one candidate: IBDverse reports that 57% of its cell types had fewer than 100 cells per donor. Its colocalization method is another, because it assumed one causal variant per locus, and TenK10K's fine-mapping finds six candidate groups of variants in the ETS2 region in CD14 monocytes, led by five distinct variants. A weaker effect in gut tissue would also explain it.
Show the code behind the chromosome 21 check
import pandas as pd

RS2836882 = 39_094_644   # GRCh38

# IBDverse's table of colocalized IBD loci: is anything on chromosome 21 near ETS2?
loci = pd.read_csv("https://static-content.springer.com/esm/art%3A10.1038%2Fs41586-026-10627-z/"
                   "MediaObjects/41586_2026_10627_MOESM4_ESM.tsv", sep="\t",
                   storage_options={"User-Agent": "Mozilla/5.0"})
print(len(loci), "colocalized loci")                               # 180
for _, row in loci.iterrows():
    for lead in row.gwas_lead.split(","):
        chrom, pos = lead.strip().split("_")[:2]
        if chrom == "chr21":
            print(row.symbol, lead.strip(), f"{abs(int(pos) - RS2836882) / 1e6:.1f} Mb from rs2836882")
# IFNGR2 chr21_33404389_A_G 5.7 Mb from rs2836882
# GATD3 chr21_44001056_A_G 4.9 Mb from rs2836882Where this leaves drug development
ETS2 itself has no drug, and making one would be hard. It is a transcription factor, and outside the nuclear receptors, transcription factors have long been considered undruggable by small molecules, because much of their structure is disordered and they lack defined pockets for a drug to bind (Henley and Koehler, 2021). As Stankey et al. note, no specific ETS2 inhibitors exist, and structural analyses show no obvious allosteric way to block it, so they turned to MEK, which acts upstream of ETS2.
Even a good ETS2 blocker would face a second problem, because ETS2 RNA is found throughout the body. GTEx detects it in all 54 of its tissues, at a median above 10 transcripts per million in 53 of them, and the Human Protein Atlas's single-cell data place it in endothelial and epithelial cells as well as immune cells. So a drug that blocked it everywhere would act far beyond gut macrophages, and MEK inhibitors, which also act throughout the body, share the problem.
- The MEK inhibitor in Stankey's experiments, PD-0325901, is mirdametinib. The FDA approved it in February 2025 as Gomekli, for plexiform neurofibromas in neurofibromatosis type 1. So the compound that damped the ETS2 program in IBD biopsies is now an approved drug.
- Gomekli's label carries no colitis warning, but diarrhea is one of its most common adverse reactions, reported in 59% of adults in its trial, and one adult had ischemic colitis. That matters in IBD, where disease-activity scores count stools. Another approved MEK inhibitor, trametinib (Mekinist), carries a label warning for colitis and gastrointestinal perforation. Stankey et al. raised long-term MEK toxicity themselves. They suggested degrading ETS2 directly, for example with PROTACs, or delivering MEK inhibitors to macrophages with antibody–drug conjugates.
- A ClinicalTrials.gov search on 31 October 2026 for MEK inhibitors (trametinib, cobimetinib, binimetinib, selumetinib, mirdametinib, avutometinib, tunlametinib, pimasertib and refametinib) in Crohn's disease, ulcerative colitis, IBD or colitis found no IBD trial.
For a drug developer, TenK10K adds independent support from public population data that the chr21q22 risk acts through monocyte chromatin, in the direction Stankey reported.
How much TenK10K recovers
I started by asking how much of Stankey's answer the TenK10K atlas would recover from resting blood. The answer is most of it: TenK10K finds the enhancer, finds that the same allele opens it, ranks rs2836882 first among the SNPs, and places the effect in monocytes. It reaches ETS2 through expression once the search widens from 100 kb to 1 Mb, as the authors showed, and it adds a pointer to cDC2 dendritic cells that nobody has tested. At ETS2 the conditions favor an atlas like TenK10K: the variant is common, its effect on chromatin is strong, and it acts in CD14 monocytes, the most abundant cell type in the data. So ETS2 shows the atlas can recover a real mechanism, without showing how often it does at loci where the variant is rare or the cell type scarce.
The inflammatory macrophage program in inflamed gut tissue makes ETS2 a drug target, and it is outside what an atlas of resting blood measures. TenK10K's donors gave resting blood and were not selected for IBD, and the gut atlas, IBDverse, did not nominate a gene at this locus. Two questions are still open after both papers: what the 11-base deletion that is inherited with rs2836882 does, and whether ETS2 drives an inflammatory program in dendritic cells.
Sources and data
- Xue A et al. Genetic variants shape single-cell chromatin accessibility and disease risk. Nature, published 28 October 2026. Supplementary Note 2 and Supplementary Table 12.
- Cuomo ASE et al. Rare and common genetic variants shape single-cell immune gene expression. Nature, published 28 October 2026. Summary statistics on Zenodo.
- Stankey CT et al. A disease-associated gene desert directs macrophage inflammation through ETS2. Nature 630, 447–456 (2024).
- Alegbe T et al. Cell-type-resolved genetic variation shapes inflammatory bowel disease risk. Nature 656, 129–139 (2026), published 3 June 2026. The colocalized-loci table is Supplementary Table 2.
- Liu Z et al. Genetic architecture of the inflammatory bowel diseases across East Asian and European ancestries. Nature Genetics 55, 796–806 (2023). The IBD effect of rs2836882 in TenK10K's SMR file (log-odds −0.1428 per A allele, SE 0.0108) matches this study's IBD entry in the GWAS Catalog (GCST90292538), and the Crohn's disease effect (−0.0793, SE 0.0147) matches its Crohn's disease entry (GCST90446792).
- TenK10K multiome summary statistics on Hugging Face: the IBD SMR results (
SMR/SMR_results_caQTL2GWAS.zip, CD14 monocytes, chromosome 21), the mvSuSiE fine-mapping table (Fine_mapping/mvSuSiE_IBD_loci.csv) and the CD14 monocyte caQTL results (caQTL_common_TensorQTL/CD14_Mono). - Henley MJ, Koehler AN. Advances in targeting 'undruggable' transcription factors with small molecules. Nature Reviews Drug Discovery 20, 669–688 (2021).
- ETS2 expression across tissues: GTEx v8 median gene expression (ENSG00000157557), via the GTEx Portal API, and the Human Protein Atlas RNA tissue and single-cell data.
- Gene and variant coordinates: Ensembl, GRCh38. The ancestral allele of rs2836882 also comes from the Ensembl REST API.
- Figure code and the extracted ETS2 peak results: tensoromics/notes, tenk10k-ets2, with a README, pinned requirements and
make_figures.sh. - Mekinist (trametinib) US prescribing information, Warnings and Precautions 5.3. Gomekli (mirdametinib) US prescribing information, Warnings and Precautions and Adverse Reactions. PD-0325901 and mirdametinib are the same compound (PubChem CID 9826528).
Working on something like this?
I take on consulting work in computational biology and AI for drug discovery. See the services or get in touch.